
How to Create Custom Reports in Google Analytics 4: A Step-by-Step Guide
Reading Time: ~4 Mins | Written By: Jason Serafica
Google Analytics 4 (GA4) offers a range of flexible reporting features that can help businesses dive deep into their data. One of the most powerful tools in GA4 is Explorations, which allows you to focus on the key metrics that matter most to your business – including custom reports tailored to your needs.

Here's how to create custom reports in GA4 in just 5 simple steps.
Benefits of Custom Reports in Google Analytics 4
Tailored Insights: Get the specific data you need to answer business questions.
Visualizations: Display your data in charts, tables, and graphs for clearer analysis.
Flexibility: Customize reports based on your business goals and adapt them as needed.
How to Create Custom Reports in 5 Steps
Step 1: Access the GA4 Interface

Log in to your GA4 account and select the property for which you want to create custom reports. Navigate to the "Explore" section in the left-hand menu. This is where you’ll create and manage custom reports.
Step 2: Choose a Report Type
GA4 provides several Exploration types that let you customize the way your data is displayed. Select the report type that best suits the goals of your analysis to start with.

Free-form: Create a custom report by easily dragging and dropping metrics and dimensions.
Funnel Exploration: Visualize user steps to optimize experience and identify performance gaps.
Path Exploration: Visualize paths users take while interacting with your website and app.
Segment Overlap: Compare user segments to identify new groups that meet specific criteria.
Cohort Exploration: Analyze the behaviour and performance of user groups with shared attributes.
User Lifetime:Analyze user behaviour and value throughout their customer journey.
Step 3: Set Up Your Report
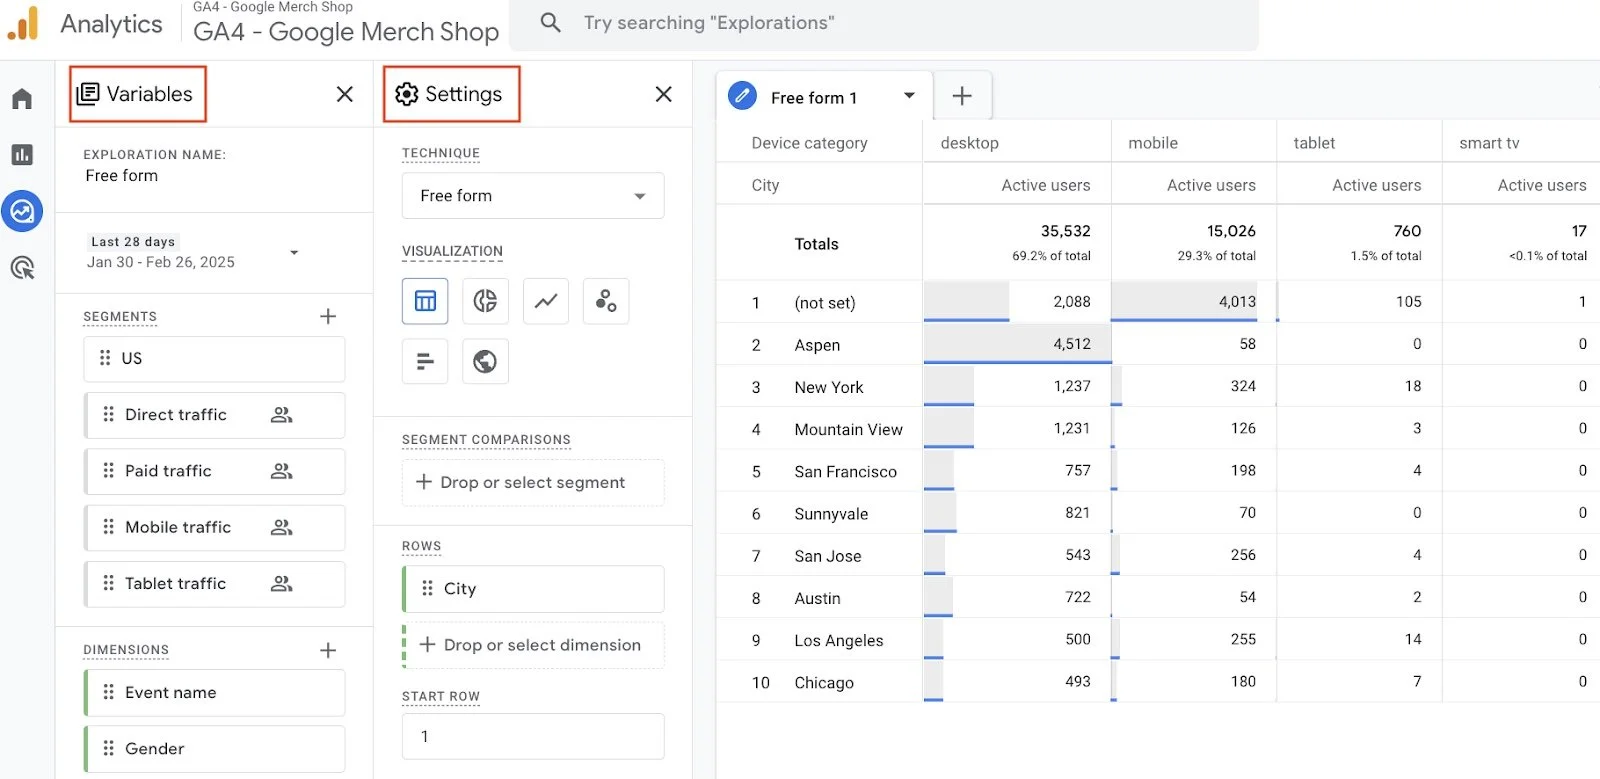
After choosing your report type, it's time to set it up:
Variables: Pick the dimensions and metrics you want to show in your report.
Settings: Adjust your report by changing the date range, or choosing a different visualization style.
Step 4: Add Segments to Compare Data
To add more depth to your analysis, you can use segments. Segments allow you to compare different user groups or behaviours, such as paid vs. direct users from different geographic locations. This helps you understand how different segments interact with the website.

Step 5: Save & Share Your Report
Once you’ve set up your report, make sure to save it for future use. You can also share the report with others by exporting it as a CSV or PDF file. This makes it easy to collaborate with team members and keep everyone aligned on key insights.

Best Practices for Creating Custom Reports in Google Analytics 4
To get the most out of custom reports in GA4 and ensure they deliver actionable insights, here are some best practices to follow:
Event Conversion Tracking
Setting up goal conversion tracking is key to measuring how well your website or app meets business goals, such as form submissions or product purchases. This helps connect your data to real business results, making insights more useful.
Tip: Check out 5 Tips for Aligning GA4 Goals with Business Objectives for help with goal tracking in GA4.
Focus on Actionable Insights
When creating reports, choose metrics that directly relate to your business goals. This helps you focus on the data that matters. For example, tracking conversion rate, session duration, or bounce rate can give you key insights into user behaviour.
Regularly Update and Refine Reports
As your business changes, your reports should too. Regularly update your custom reports to keep them in line with your current needs and goals. Over time, new trends or key metrics may emerge, so it's important to review and adjust your reports.
Get Valuable Insights with Custom Reports in GA4
Creating custom reports in Google Analytics 4 helps you uncover valuable insights that align with your business goals. By following the 5 simple steps, you can create reports that track the metrics and behaviours that matter most.
With the right setup, custom reports can guide your decisions, improve user experience, and help you achieve your goals. Keep refining your reports and experimenting with different report types to stay ahead and make the most of your data.
If you want to learn more about how to effectively use Google Analytics 4 and gain deeper insights into your website traffic, our Digital Marketing Bootcamp covers all the essentials. We’ll help you understand how to track customer engagement and evaluate the performance of your marketing channels.