
5 Essential Metrics When Analyzing Web Analytics
Reading Time: ~4 Mins | Written By: Simon Frackiewicz

Web analytics platforms can be confusing to read at first glance, feeling like “information overload”. The most popular web analytics platform is Google Analytics, and there’s a lot to see when browsing through your reports. There’s something for everyone on Google Analytics, but what are the most important metrics to look at when deciding if your site is doing what it’s supposed to do?
Most businesses want to make sure their site is engaging with their audience. What does that mean in terms of web analytics? For our example, we will be using Google Analytics 4 as it is the future of web analytics.
Engagements: Why they’re important for Web Analytics
Engagement is defined as anything that a user does to interact with your website. That means clicking to different pages, clicking on buttons, session duration, scrolling down through pages, certain session durations, purchases, lead form submissions, and so much more. Within the lens of Google Analytics, an Engagement is anything you define as an engagement.
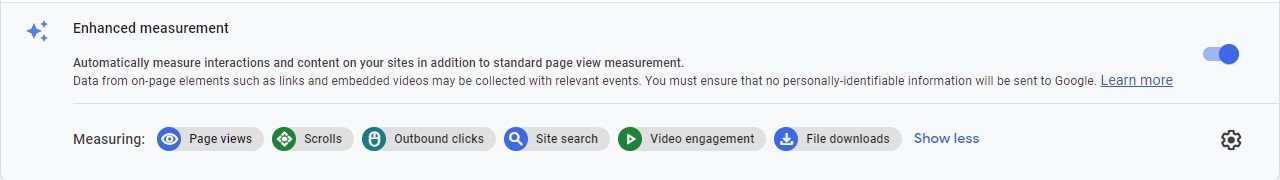
Google Analytics 4 has many common Engagement types automatically defined upon installation on your site:
Page Views
Scrolls
Outbound Clicks
Site Searches
Video Engagements
File Downloads
These are the Enhanced Measurement features available with every installation of Google Analytics.
Not all Engagements are equal…

However, not all Engagements are born equal. Some are more important than others. This would come in the form of Conversions: events that are most important to your business. We can define some Engagement events as more important than others, making them Conversions.
Using the left-hand navigation bar, we can access the Conversions menu. This is where we can create new Conversions to measure and optimize for with our web analytics measurement.

Simply click the blue button in the top right corner of the Conversions menu, and create a New conversion event. If your conversion name matches the conversion event you created in Google Tag Manager , it will automatically start tracking as a conversion.
Now that the essentials are out of the way, let’s talk about the most important metrics when measuring Engagement on our website!
#1: Engaged Sessions
Engaged sessions are the number of sessions that lasted longer than 10 seconds, or had a conversion event, or had 2 or more screen or page views. This metric is a good indicator for measuring what traffic sources bring in the most engagement. Knowing how many Engaged Sessions a traffic source brings in allows you to make a data-driven marketing decision about which traffic sources to scale up to further increase results.
Example: You have a blog that publishes posts on dog wellness and health. You ideally want users to click on a post and read it! You will care about whether or not users click on a post after landing on your site in order to measure how effective your site is at getting that first engagement.
#2: Average Engagement Time Per Session
This metric tells you the average amount of time in minutes that a user spends engaged on your website. It is best used for determining how sensitive your audience is to content types, both in terms of on-site SEO and paid advertising. Longer engagement time is usually better.
Example: Your dog wellness blog posts once per day, and there’s a lot of content users can choose from when they land on your site. You run paid ads, organic social, and actively work on your on-site SEO. You will want to know which traffic channels generate the most engaged users. By seeing which traffic source spends the most time on your website on average, you’ll be able to scale up your marketing efforts for the winning traffic source.
#3: Engaged Sessions Per User
This metric tells you how many sessions a single user engages in on your website, on average. It’s best used for determining how efficient a traffic source is at generating a returning, long-term user base for your website.
Example: Your dog blog’s organic social users’ Engaged Sessions Per User is 1.1, and your Google Ads paid traffic users’ is 0.8. This means that your organic users are more likely to become long term returning users of your website, and you should continue to scale up your organic efforts while scaling back your paid traffic.
#4: Events Per Session
This is the number of events completed per session by the average user. This metric is best used to interpret how efficient your website content is at inspiring engagements for the average user.
Example: Your dog blog’s organic social users are performing about 6 engagements per session, and your email traffic users are performing about 2 engagements per session. You may want to consider putting more of your efforts into producing engaging social media content than emails for your drip campaign.
#5: Engagement Rate
This metric is the number of engaged sessions, divided by the total number of sessions expressed as a percentage. It gives us insight into how efficient a page or piece of content is at getting users to click through and engage with it.
Example: Your dog blog’s training tip posts are generating a 10% engagement rate, and your wellness and diet posts are generating about a 6% engagement rate. Your training tip posts are more likely to generate a click, or a read, or a longer session and you should consider producing more content like that to generate more overall engagement on your site.

If you want to become a certified web analytics professional, check out our 6-week digital marketing program, Jelly Academy! Learn job-ready skills about web analytics, digital ads, social media, public relations, and so much more.