
Understanding the Basics of GA4 Data Analysis
Reading Time: ~3 Mins | Written By: Cheryl Goeres
In 2020, Google introduced their new analytics, Google Analytics 4, or GA4. One of the biggest differences between Universal Analytics and Google Analytics 4 is the platform interface: they are vastly different.
Another key difference is that GA4 is focused on website engagement and engaged users (engaged users are defined by 10+ second sessions, 2 or more page views, or a conversion action). You will no longer see a Bounce Rate in GA4 (ie. percentage of visitors who land on one page of your website and then leave).
Since it focuses on engagement, GA4 will automatically detect events such as video plays, scroll depth, clicks, and file downloads, giving you even more insight into your visitors’ behaviour on your website. Historically, these are events that you would have to manually set up yourself in Google Tag Manager to send to Universal Google Analytics (AKA the old Google Analytics).

Navigating the GA4 Platform
User Attributes Reports (was Audience Reports in Universal Analytics)
User reports are detailed reports on who is visiting your website. Such as their age range, gender, interests and where in the world they are located.
To find User Attributes Reports in GA4, go to “User”. This section tells you how many people have visited your site each day. This report is very important to track. Keeping an eye on your visitor count will tell you if your visitors are increasing or decreasing, if you have specific days that always bring in the most traffic, or if you have months that bring in the most traffic. It will also give you information on the top geographical locations of your website visitors and how active they are on your website.

Demographic Overview in User Attributes Report in GA4
Acquisition Reports (was Acquisition Reports in Universal Analytics)
Acquisition reports contain information on how visitors came to your website. Google Analytics can tell you if they came directly to your website, found it via an organic search, or were directed from ads or social media.
Under Acquisition in GA4 is an Acquisition Overview. This section gives you an overview of each digital channel that is bringing traffic to your website. This will help you define which marketing tactics are bringing in the most traffic. To see additional metrics on a specific report in the overview, click the blue arrow at the bottom of any overview.
Traffic Acquisition will be a go-to report for analyzing all traffic to your website. For more information on understanding KPIs to track within the report, view our guide here.

Acquisition Overview in GA4
Engagement Reports (was Behaviour Reports in Universal Analytics)
Engagement reports give you insights into what your visitors are doing once they get to your website. You will find your most popular pages here as well as a flow chart visualizing how visitors are interacting with your website.
The Engagement Overview is a breakdown of your website performance via Pageviews, Average Time on Page and Average Engagement Time. It will also show you your top pages and top landing pages. In GA4 you will find this overview under Engagement. Events and Conversions will also be under the Engagement tab.

Engagement Overview in GA4
Engagement Reports (was Conversion Reports in Universal Analytics)
Conversion reports report on any action that is happening on your website that is important to your business. Once someone is interacting with your website, you can find out if they are contacting you, purchasing a product, signing up for a newsletter, and more.
In the Engagement Report under Conversions, there is a snapshot of all of the conversions you have set up. It’s a great place to quickly see how many conversions your visitors have completed within a period of time.
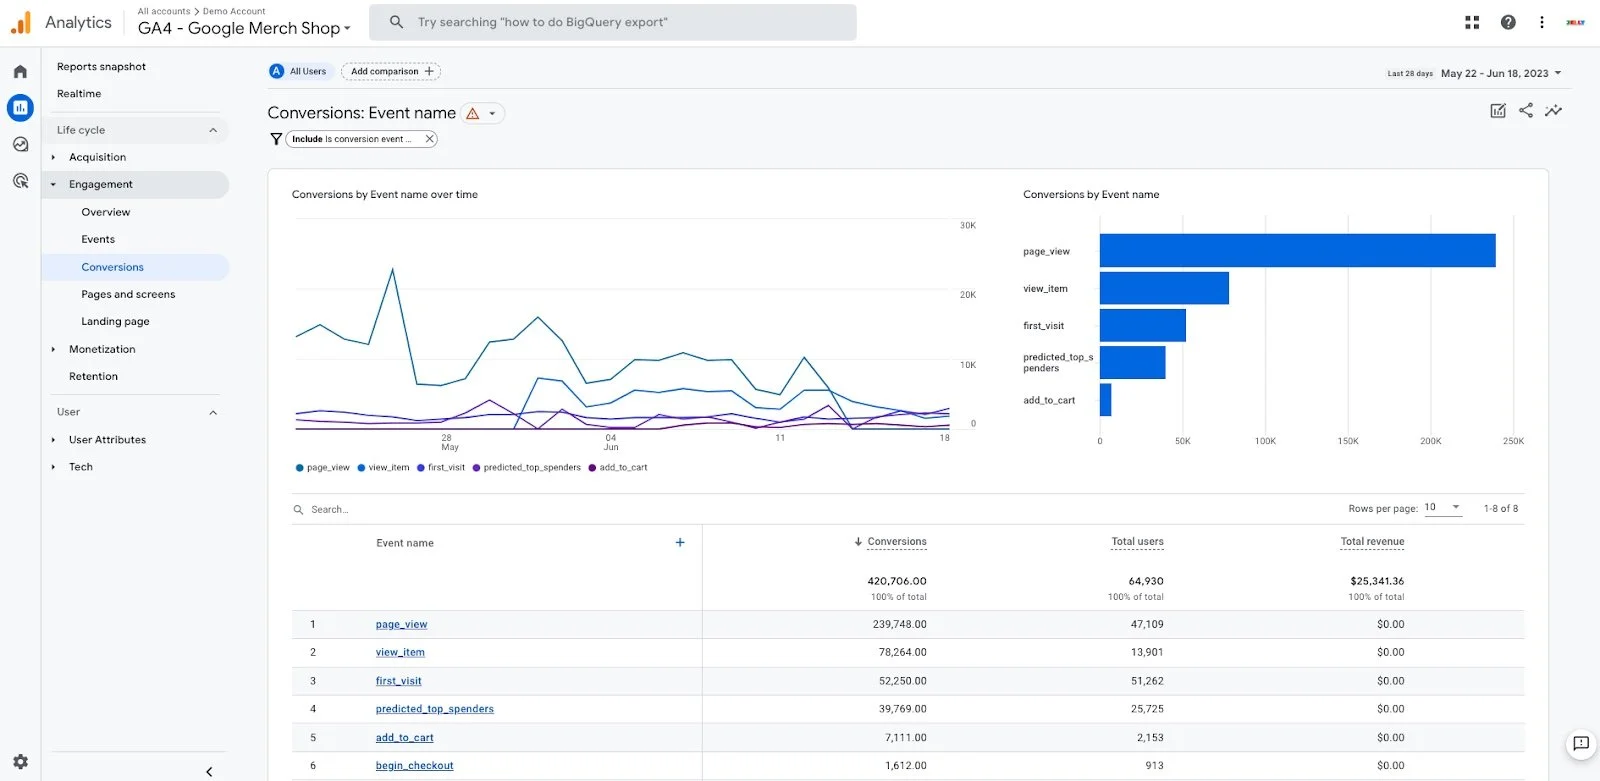
Conversions Report in GA4
Monetization Report (were Ecommerce Reports in Universal Analytics)
If you have an e-commerce website, the Monetization Report is where you will have all of your data on revenue, product sales, etc.

Monetization Report in GA4
Navigating the GA4 platform can be daunting at first, but the more time you spend within the platform, the more familiar you will be. The platform is quite consistent in how the data is laid out which helps when understanding the metrics you are looking at.
If you want to dive deeper into GA4, check out our Digital Marketing Bootcamp that covers GA4 in one of the sessions.