
Beginners Guide to Google Analytics
Reading Time: ~4 Mins

Whether you’re a large business, small business or just running a personal blog, your website analytics plays a crucial role in your marketing efforts.
From collecting data on where your site visitors are coming from, to your best performing pages, Google Analytics contains a variety of reports to help you better understand your website's performance.
What is Google Analytics?
Google Analytics is a free website analytics tool that helps you analyze your website traffic. It gathers data on four different categories related to your website: audience, acquisition, behaviour and conversions.
Audience Reports
Audience reports are detailed reports on WHO is visiting your website. Such as their age range, gender, interests and where in the world they are located.
Acquisition Reports
Acquisition reports contain information on HOW visitors came to your website. It will tell you if they came directly to your website, found it via an organic search, or from ads or social media.
Behaviour Reports
Behaviour reports give you insights on WHAT your visitors are doing once they get to your website. You will find your most popular pages here as well as a flow chart visualizing how visitors are interacting with your website.
Conversion Reports
Conversion reports report on any ACTION that is happening on your website that is important to your business. Once someone is interacting with your website, you can find out if they are contacting you, purchasing a product, signing up for a newsletter, and more.
Why use Google Analytics?
Your website plays an important role in your business, especially in today’s digital age. With Google Analytics, you will be able to analyze and understand how effective your website is.
You will also be able to determine which marketing efforts are performing best for your business.
You can find answers to questions like; “Where are my visitors located?”, “How did they get to my site?”, “Did they take any action?”, “What are my most popular pages?” etc.
What is the difference between Universal Google Analytics and Google Analytics 4?
Over the last few years, Google has introduced a new analytics called Google Analytics 4, or GA4. The biggest difference between the two is the platform interface: they are vastly different.
Another key difference is that GA4 is focused on website engagement and engaged users (10 second sessions or longer). You will no longer see a Bounce Rate in GA4 (ie. percentage of visitors who land on one page of your website then leave).
Since it focuses on engagement, GA4 will automatically detect events such as video plays, scroll depth, clicks, and file downloads, giving you even more insight into your visitors’ behaviour on your website. Historically, these are events that you would have to manually set up yourself in Google Tag Manager to send to Universal Google Analytics.
Key areas of focus in Universal Google Analytics
Each report in Google Analytics has an Overview section. These are great places to start if you’re just beginning to use the tool.
Audience Overview
This section tells you how many people have visited your site each day. This report is very important to track. Keeping an eye on your visitor count will tell you if your visitors are increasing or decreasing, if you have specific days that always bring in the most traffic, or if you have months that bring in the most traffic.

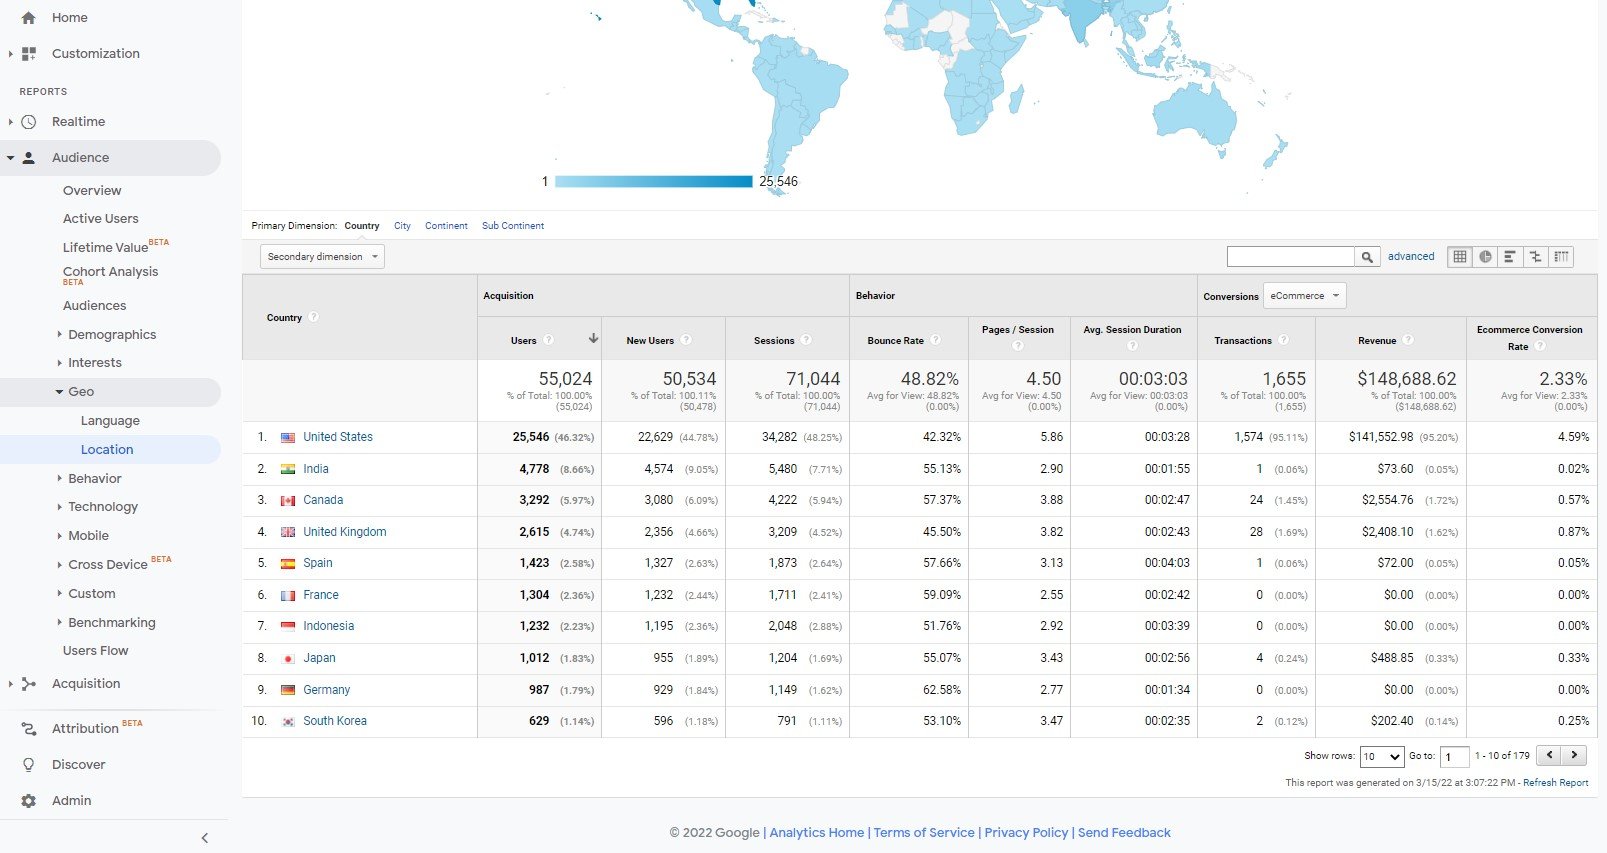
Under the Audience reports, the Geo section is also a key focus as that will tell you where your visitors are located.
Acquisition Overview
This section gives you an overview of each digital channel that is bringing traffic to your website. This will help you define which marketing tactics are bringing in the most traffic.

Behaviour Overview
This section breaks down your website performance via Pageviews, Average Time on Page and Bounce Rate. It will also show you your top 10 pages.

Conversions Goals Overview
This section is a snapshot of all of your goals you have set up in Google Analytics. It’s a great place to quickly see how many conversion goals your visitors have completed within a period of time.

Key areas of focus in Google Analytics 4
GA4 contains similar reports to Universal Analytics, but it also has a quick snapshot of all the key reports from each category in one dashboard. This can be found in Reports > Reports Snapshot.
The Reports Snapshot will give you information on how many users have come to your website, how they got to your website, where your visitors are located, your pages with the most views, top events and top conversions.

As a beginner, GA4 can be quite overwhelming. It’s best to start with Universal Analytics, become comfortable with that platform and then learn GA4. If it’s also your first time setting up a Google Analytics account, it will default to setting up a GA4 instead of a Universal Analytics. Make sure you select Advanced Options when you’re on Step 2 and toggle on Create a Universal Analytics Property. Keep in mind that Google recently announced that as of July 1, 2023, Universal Analytics will no longer be collecting data and GA4 will be the main Google Analytics platform.

To learn more about Universal Analytics and GA4, our 6-week digital marketing program includes a full session on website analytics.
Written by: Cheryl Goeres